I’ve done a quick scan of the latest US data I could find on out of wedlock births, and some of the data is very interesting. The first thing that surprised* me is that the percent of births out of wedlock leveled off and even declined very slightly after 2009. You can see this in Figure 1 from the 2014 NCHS data brief Recent Declines in Nonmarital Childbearing in the United States:
The chart above only goes through 2013, but according to this January 2017 National Vital Statistics Report the trend has continued through at least 2015, the last year we currently have data for:
The percentage of all births to unmarried women was 40.3%
in 2015, similar to the 2014 percentage of 40.2% in 2014, the
lowest levels since 2007. The percentage of all births to unmarried
women peaked in 2009 at 41.0%. In 2015, the percentage of
nonmarital births varied widely among population groups, from
16.4% for API mothers to 70.6% for non-Hispanic black mothers
(Table 15).
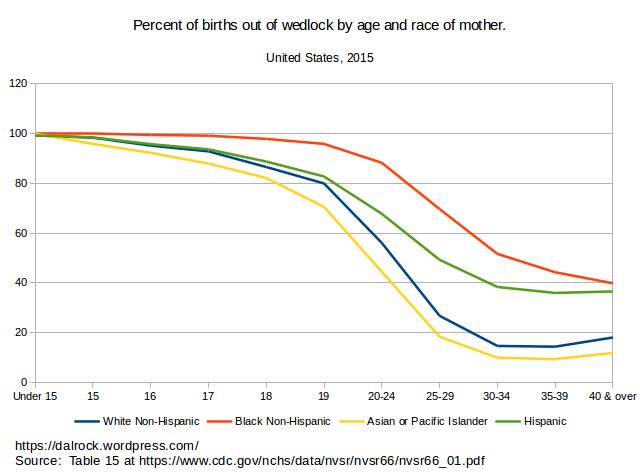
Table 15 is itself quite interesting because it gives us some context for cases like Sarah Lenti’s. For women of all races, the percent of births out of wedlock starts at or near 100% for the youngest cohorts, and declines dramatically as you look at older cohorts through the early 30s. At this point the pattern diverges by race. For Black women, the drop continues after the early 30s, but at a much slower rate. For Hispanic women, the percent of births out of wedlock declines slightly in their late 30s and then remains flat. For White and Asian women, after declining less quickly in their late 30s, the percentage of births out of wedlock not only stops declining but actually increases for women over 40:
Here is the same data, but only focusing on White and Asian women and dropping the teenage brackets:
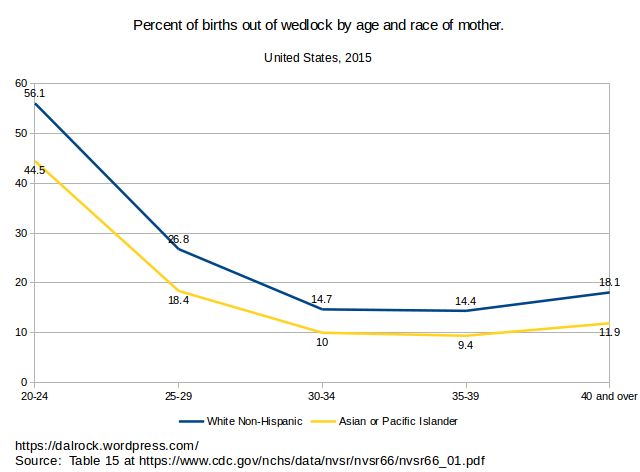
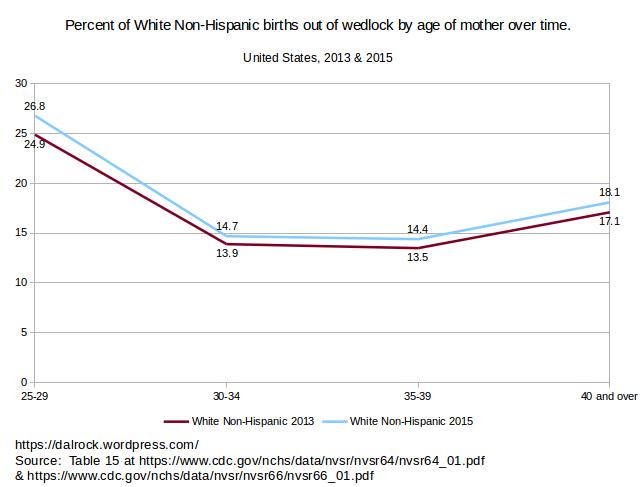
From the data, it does look like we are seeing a spike of aging White and Asian career women intentionally deciding to go it alone at the last minute after failing to find a husband. The spike isn’t huge in absolute terms, but the pattern is easy to spot. The same pattern exists in the 2013 version of the same table:
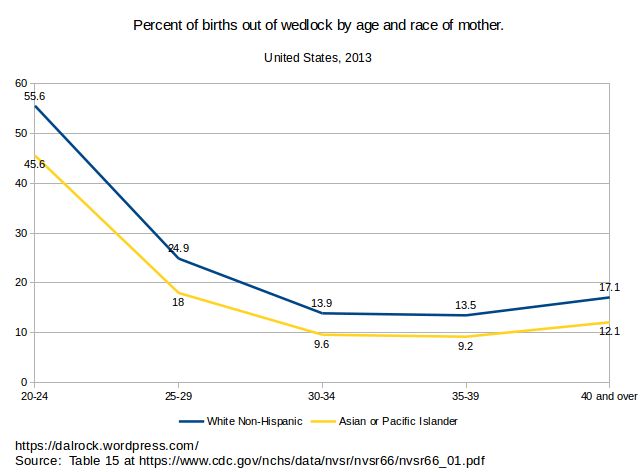
Zeroing in just on White women, despite the fact that the overall percentage of births out of wedlock declined very slightly between 2013 and 2015, the percentage increased in this time period for all older age brackets:
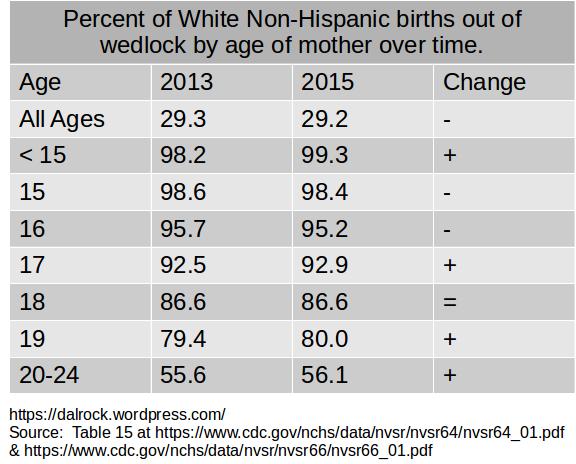
The youngest brackets aren’t included in the chart above, but the only age brackets to decline between 2013 and 2015 were ages 15 and 16:
*I had forgotten about the data I shared in this post two years ago.
Leave a Reply