I was curious about the demographics of family structure so I put together some more charts from the same data set as the last post. I’ve created two charts for each category, with the first showing the percentage of children living with both parents, and the second showing the rest. The more detailed charts have larger versions available if you click on them (check for mouseover).
Overall the data reinforces how much of a race and class marker marriage has become for raising children. While we can’t take the “both parents” data at face value since it includes nebulously defined step parents (mostly stepfathers), this does show that for specific segments of society marriage is still extremely important when it comes to having and raising children. We already know that college educated women are far less likely to divorce, and it would appear from the charts below that when they do divorce remarriage is still an essential part of the script if children are involved. This focus on marriage for raising children is currently running up against declining marriage rates, which means that something will have to give.
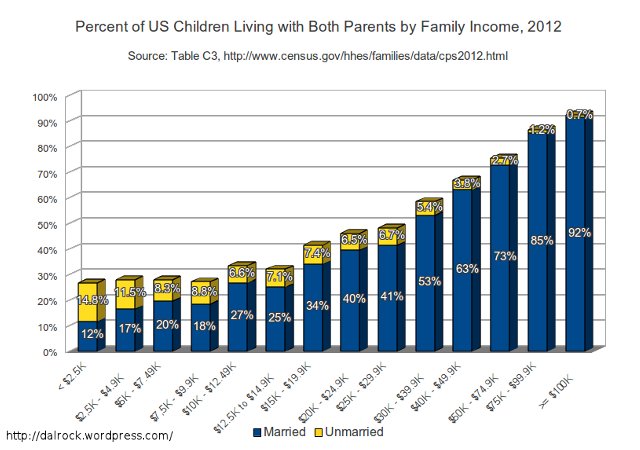
Here is the percentage of children living with both parents, by family income.
Edit: Kman pointed out that following separation family income will drop, so the income comparison is problematic. This is confirmed by the relevant definitions in the CPS definitions page. The comparison based on education below is a better measure of the impact of socioeconomic status on living arrangements.
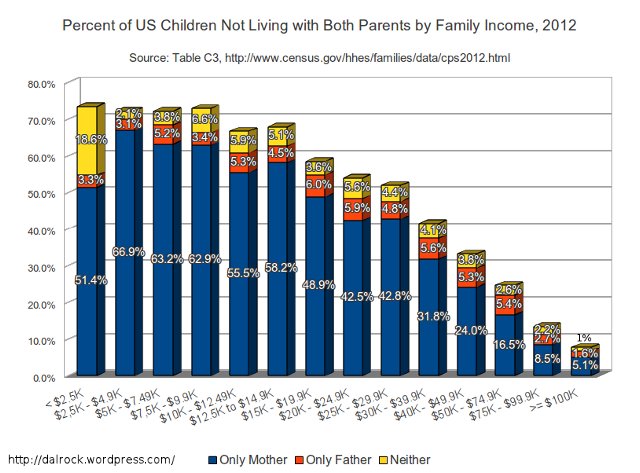
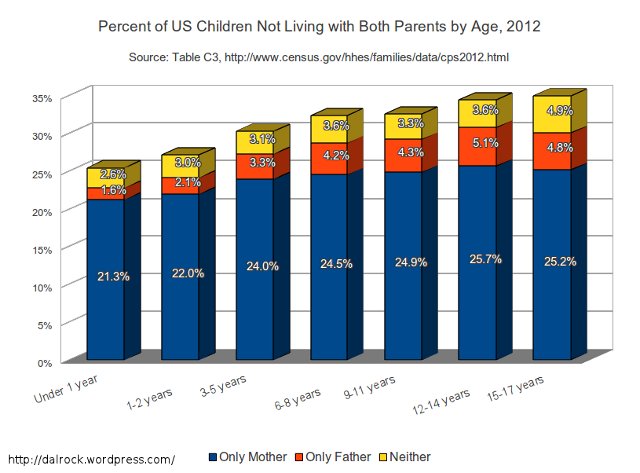
Here is the same basic view but showing the remaining categories:
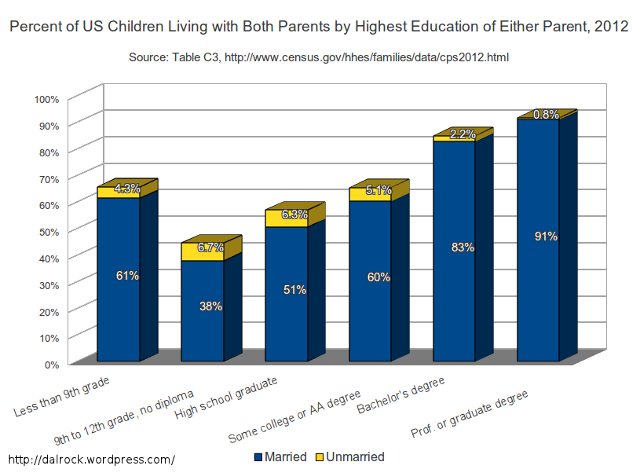
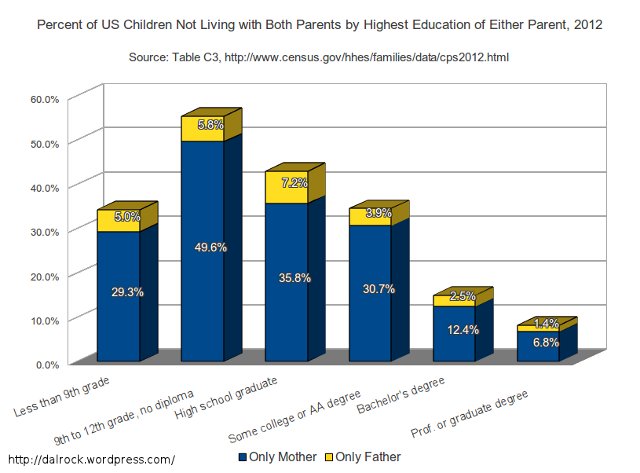
There is a similar pattern by education, although note the interesting results for those with less than a 9th grade education. I didn’t chart it out but children of foreign born parents lived with both married parents 76% of the time and lived with both parents (married or not) roughly 80% of the time. Because of this, I suspect that the first column on the education chart may be more reflective of first generation immigration patterns than native education:
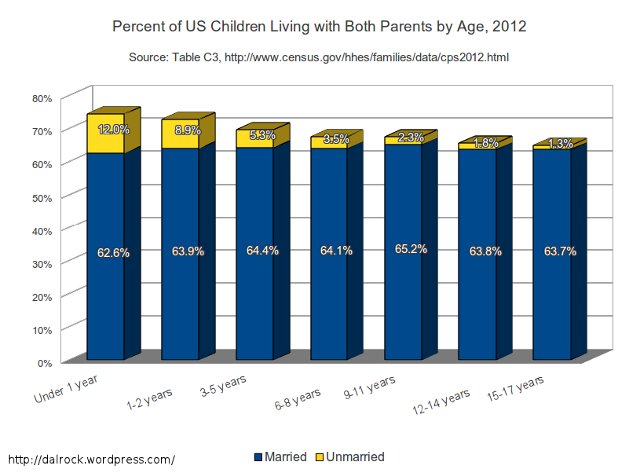
The following two charts show the breakdown by the age of the child. Note that the category of children with unmarried cohabiting parents shrinks dramatically as we look at older age brackets. However, it isn’t possible to say how much of this represents the instability of cohabitation compared to marriage. Some of this could be due to the rising out of wedlock birth rate over the last 20 years; the children who are oldest today started off with a higher percentage of married parents. Also, to the extent that initially unmarried cohabiting parents are tying the knot over time this would also shrink the category.
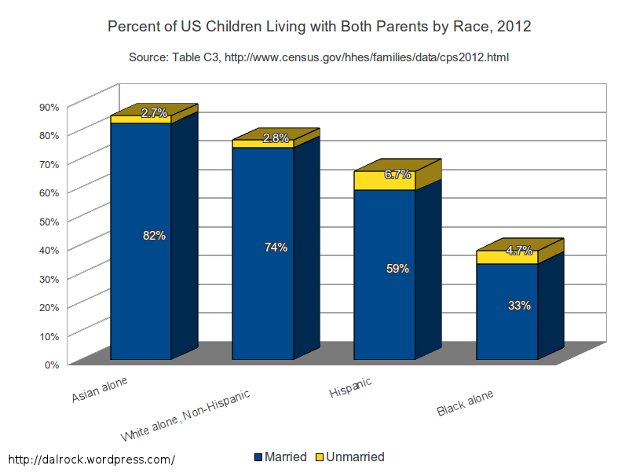
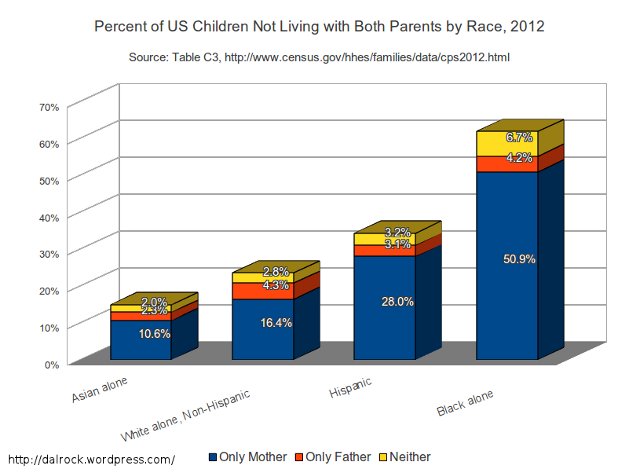
Here is the same breakdown by race:
Leave a Reply