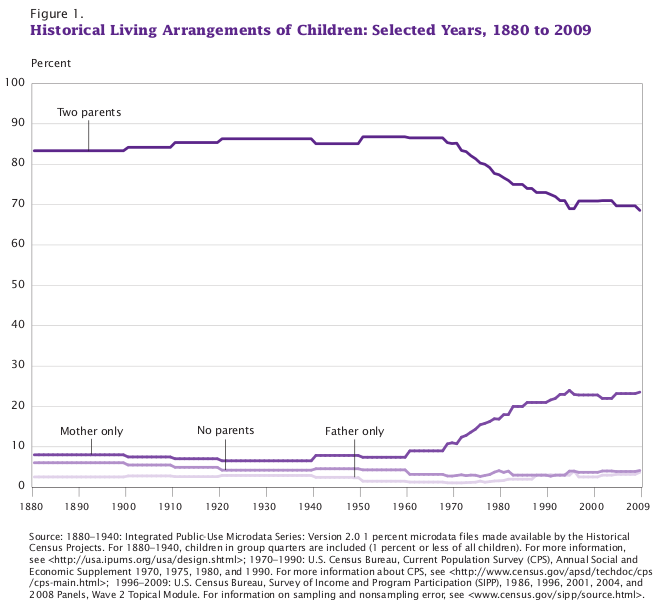
I found this chart in the Census paper Living Arrangements of Children: 2009.
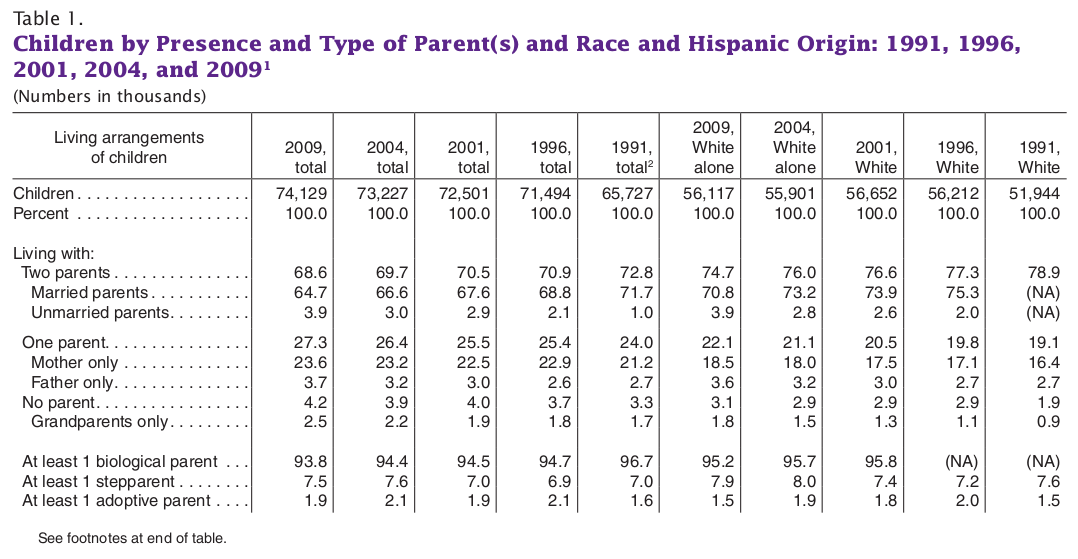
 The sudden drop in the percentage of children living with both parents starting in 1970 is profound but not unexpected given the changes which began around the same time with regard to out of wedlock births and divorce. We are clearly in uncharted territory. The plateau starting around 1990 is very interesting, and at first glance looks like fairly good news. Here is the yearly breakdown between married and unmarried couples in Table 1 from the paper (note table is in reverse chronological order and is split between all races on the left and white on the right):
 The leveling off in the living arrangements chart appears to be entirely due to the drop in divorce rates which started in the 1980s, because out of wedlock birth rates continue to increase at an alarming rate. Given that 40% of all babies born in the US in 2007 were out of wedlock and the very small percentage of out of wedlock children who live with both parents, even if divorce rates and out of wedlock birth rates remained constant moving forward I think we can assume that the percent of children in two parent homes would continue to decline to below 60% before leveling off again. The only way we could avoid this level or greater decline would be if divorce rates continue to fall and/or unmarried parents became a more stable relationship.
Your guess is as good as mine on what we will see in the future.
Edit: Based on the data in Table 1, the “two parent” figure includes 7.5% of children living with at least one stepparent. Subtracting this from the 68.6% “two parent” figure, this means the real figure is 61.1%
Leave a Reply